

UPDATED APRIL 2026
Investment Manual: Sports Trading
Fanstrader is a digital sports financial market where you can trade virtual assets based on the real performance of teams and athletes. Pure Strategy based on data and sports results.
28K
Traders
15+
Leagues
2.4M
Ops/Month
0ms
Latency
The 4 Pillars
Innovation: The final share values in each competition are already assigned before it begins.
Skill: Personal decisions based on data analysis and sports results.
Real Ecosystem: Values based on sports results in each competition.
Dynamic Market: You can trade constantly in a market open 24/7.
2. Markets Screen
The operations center where you control all available competitions.
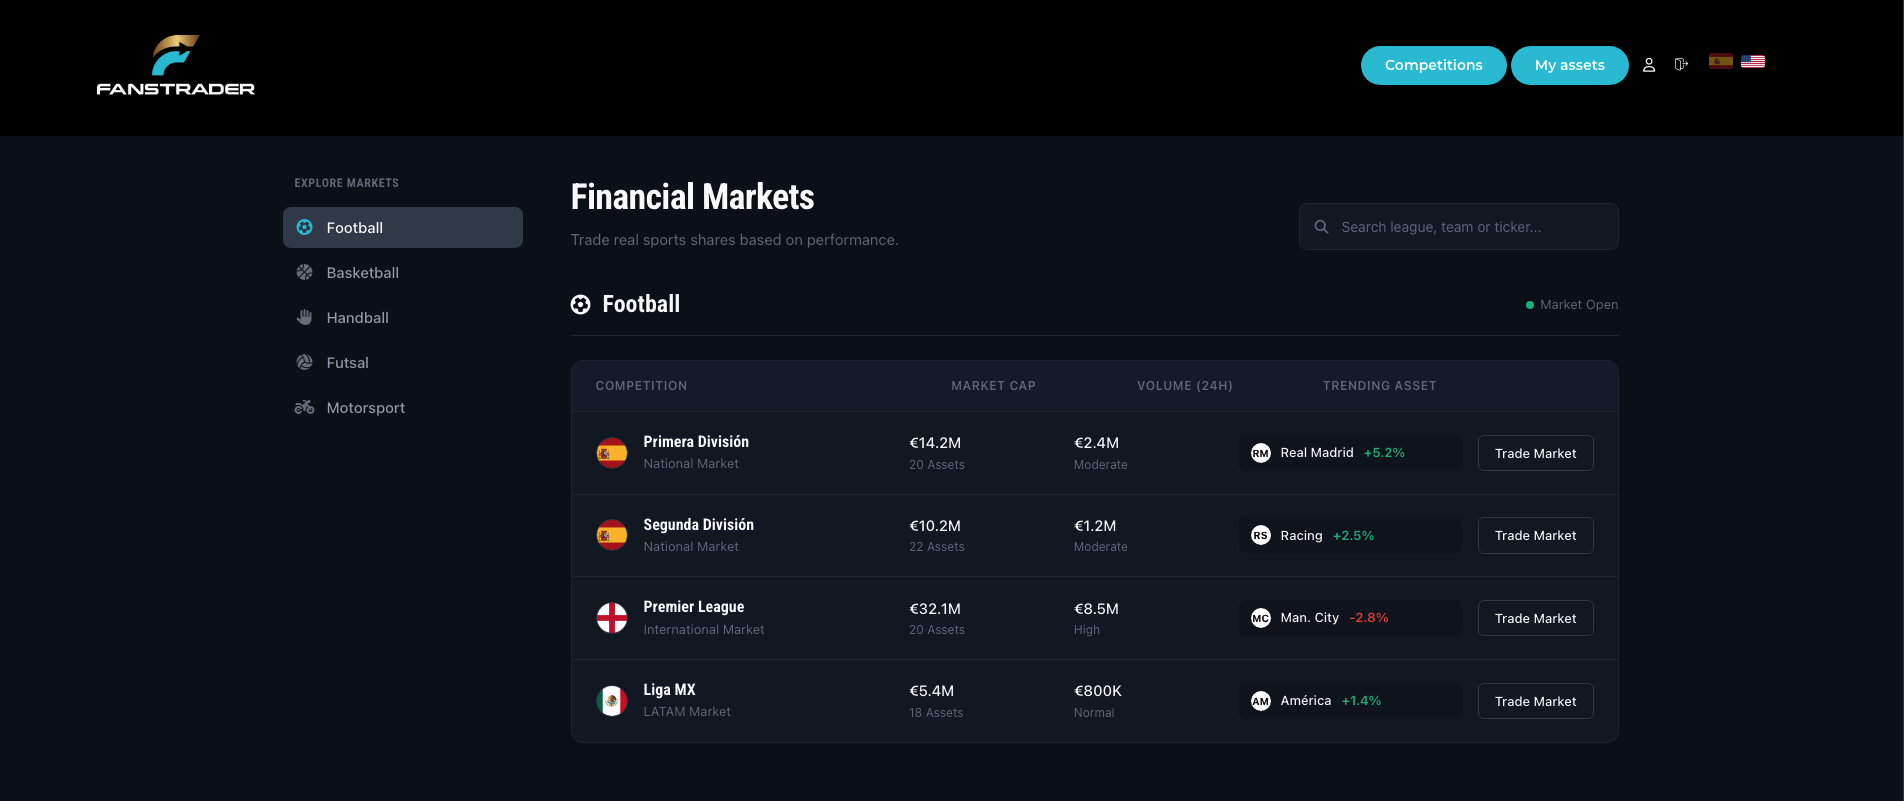
Side Menu
Quickly navigate between Football, Basketball, Motorsport and more.
Market Status
The green dot indicates that trading is open for that league.
Trade Market
Direct button to enter the price table of the chosen league.
3. League Operations
View standings, points and market values in a single dynamic table.
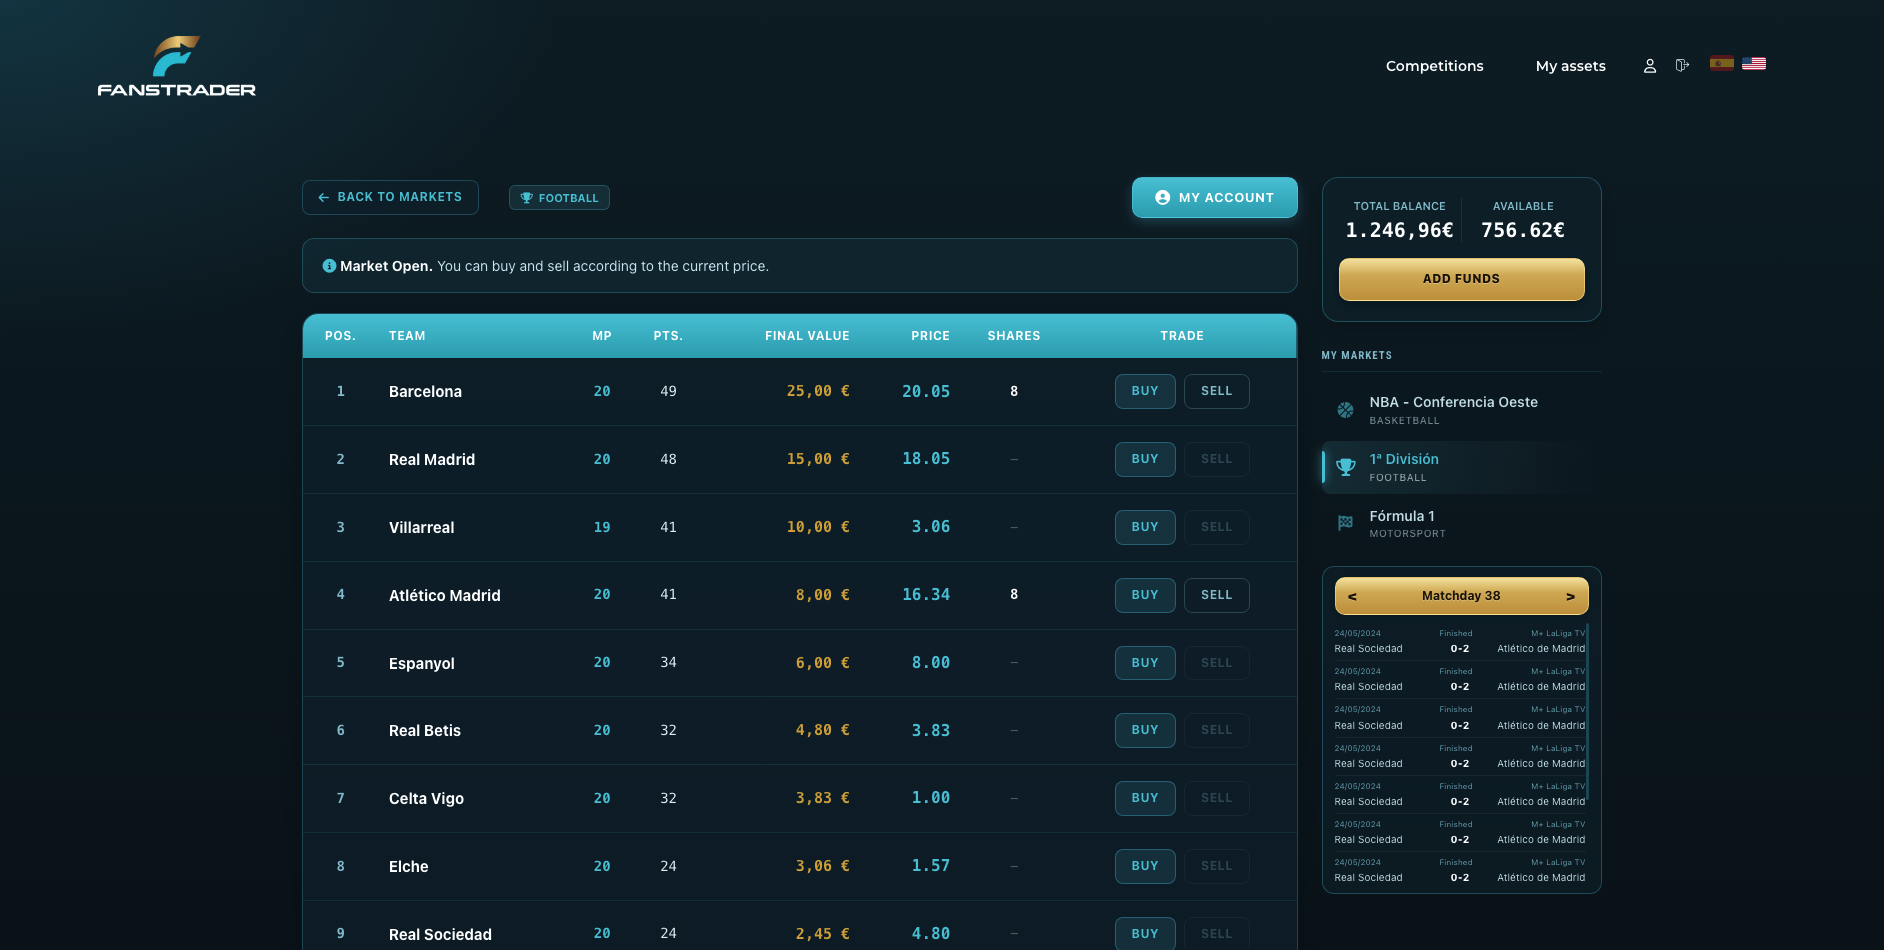
Team Information
MP / PTS
Matches Played and Points
Final Value
Value per position at the end of the competition
Price
Instant buy/sell value
Shares
Number of shares you own
Account Balance
Total Balance
Cash + value of shares you own
Available
Cash available to buy
Action Button
"Add Funds" lets you top up your balance quickly.
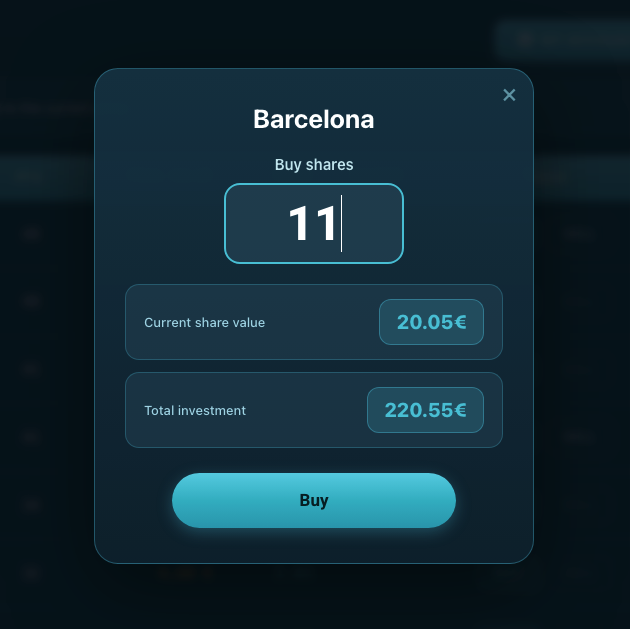
4. Buying Process
01
Trade
Click BUY on the desired team.
02
Configure
Enter the quantity. The system will calculate the Total Investment automatically.
03
Execute
Verify the share value and press Buy.
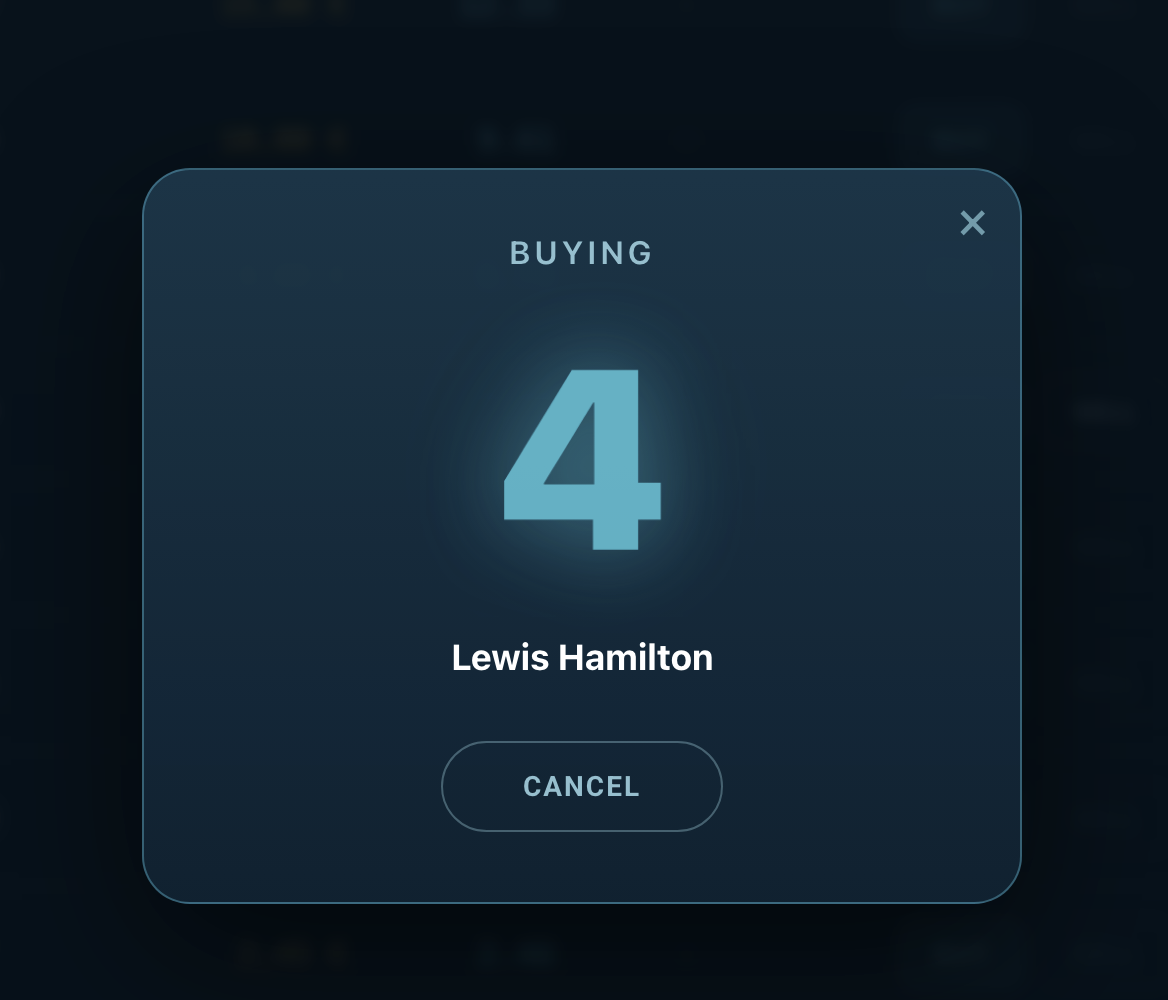
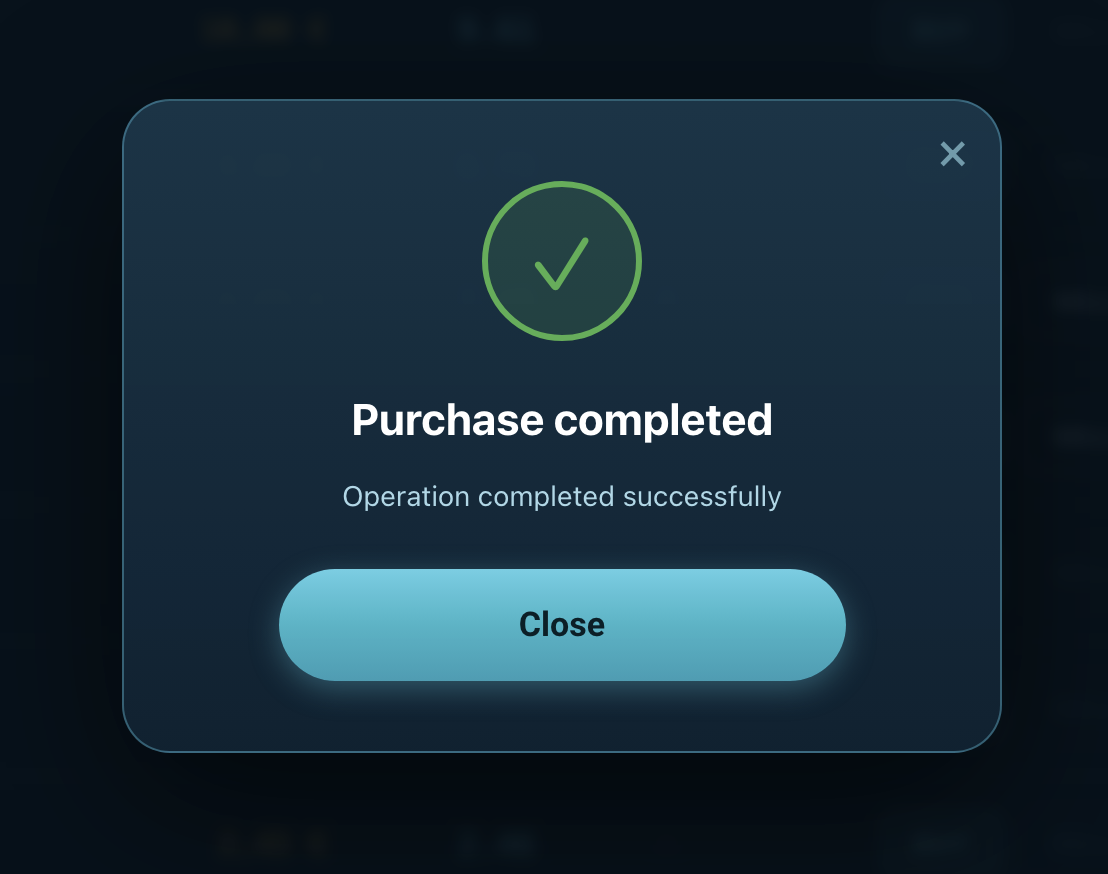
04
Confirmation
A countdown will appear and then the purchase confirmation.
5. My Assets
Your personal inventory. Monitor each individual investment and its current performance.
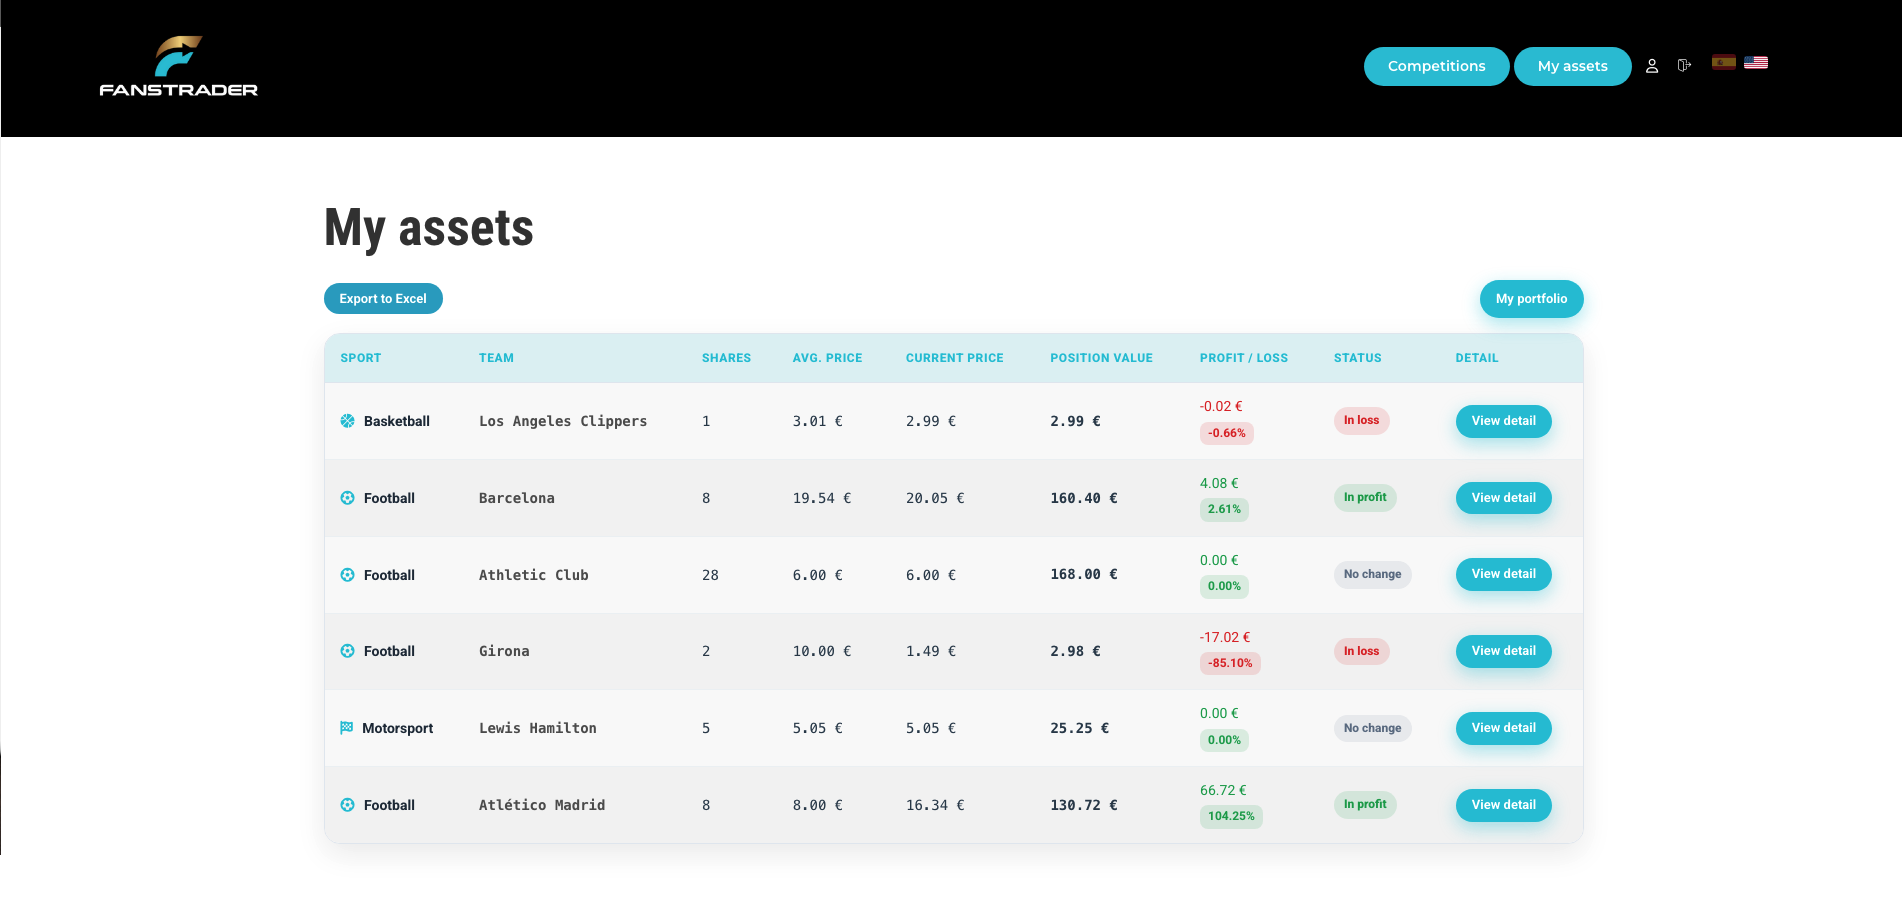
Average Value
The average cost at which you acquired shares of that team.
Profit / Loss
Net difference in value. Shown in green (profit) or red (loss).
View Detail
Button to access deep analysis and historical chart of the team.
6. My Global Portfolio
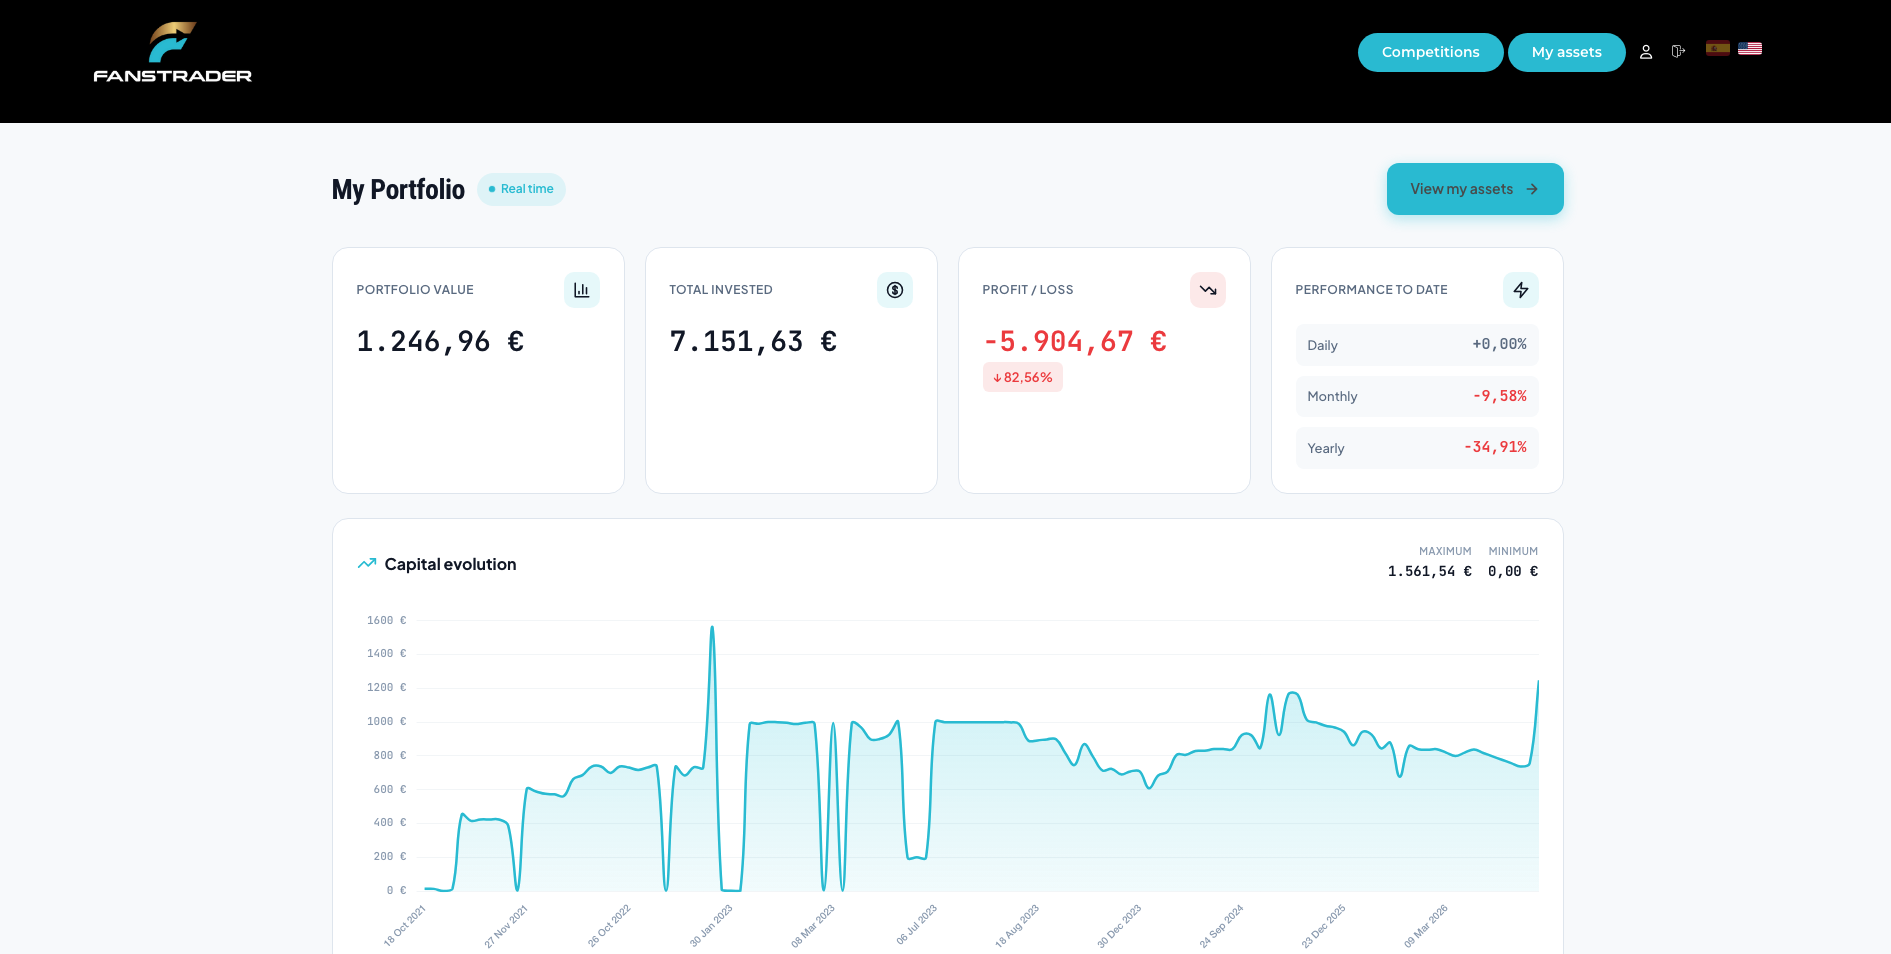
Capital Analysis
The Capital Evolution chart visually shows how your account has grown since day one. Performance indicators (Daily, Monthly, Yearly) help you measure your success as a sports trader in the long run.
7. Individual Investment Detail
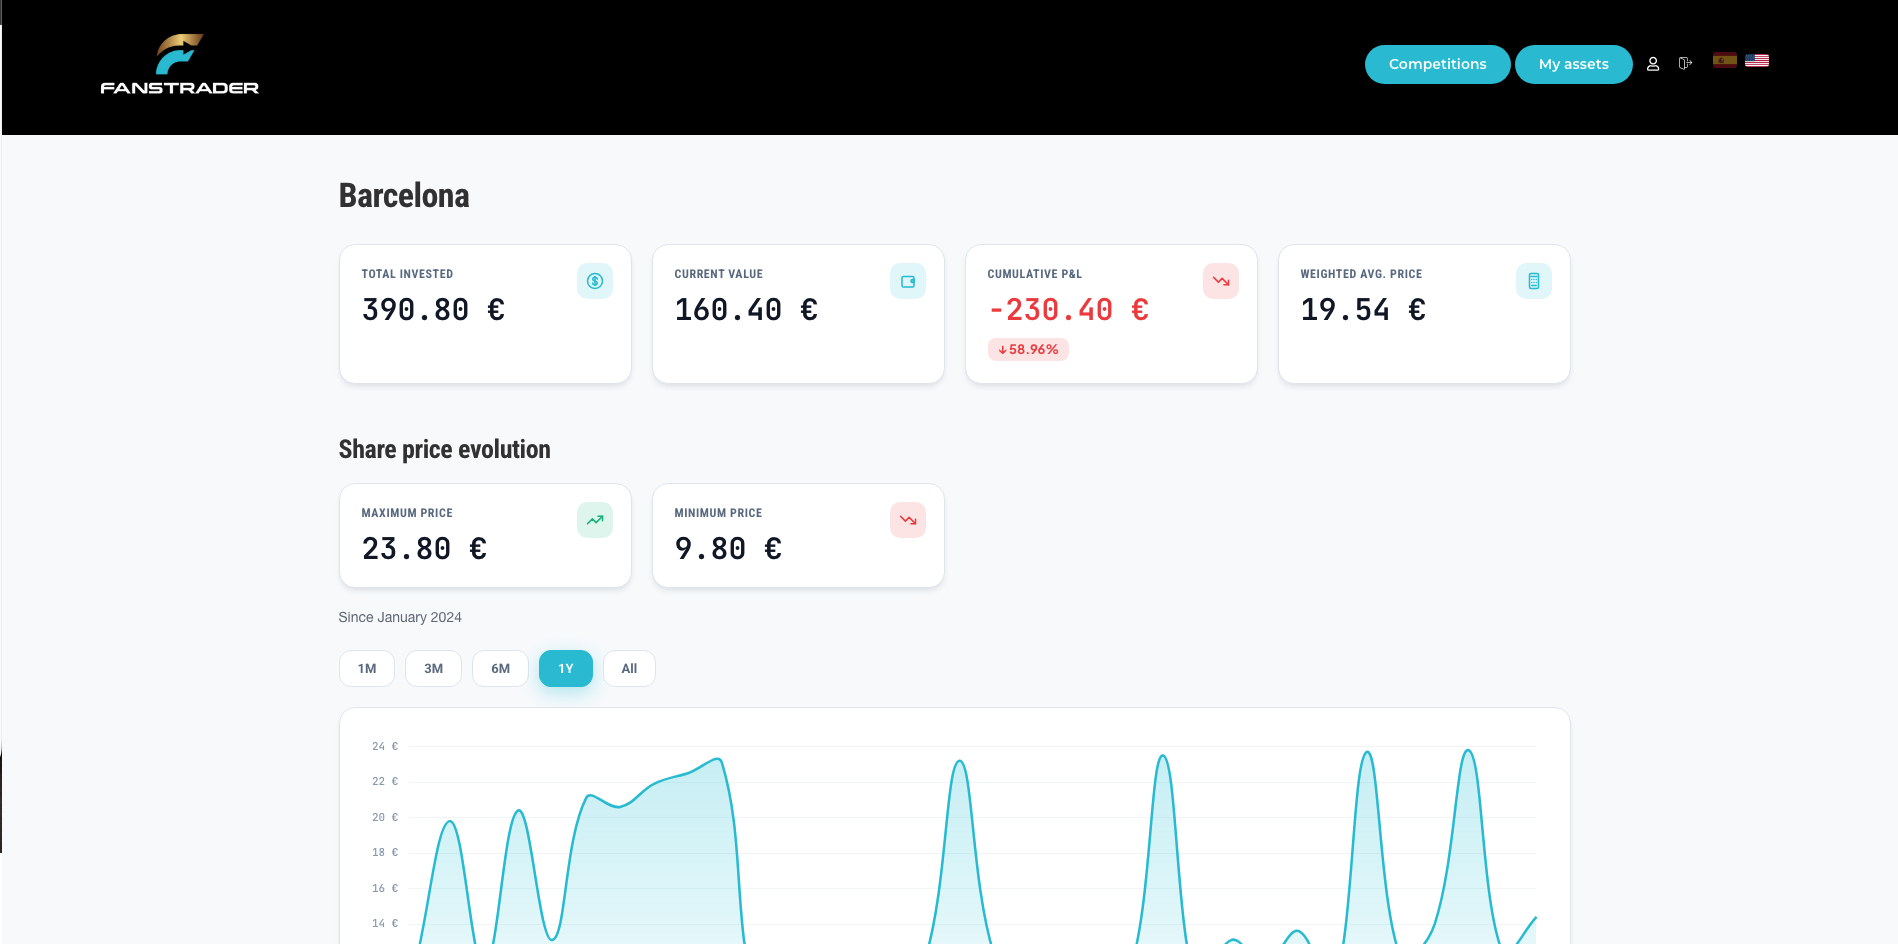
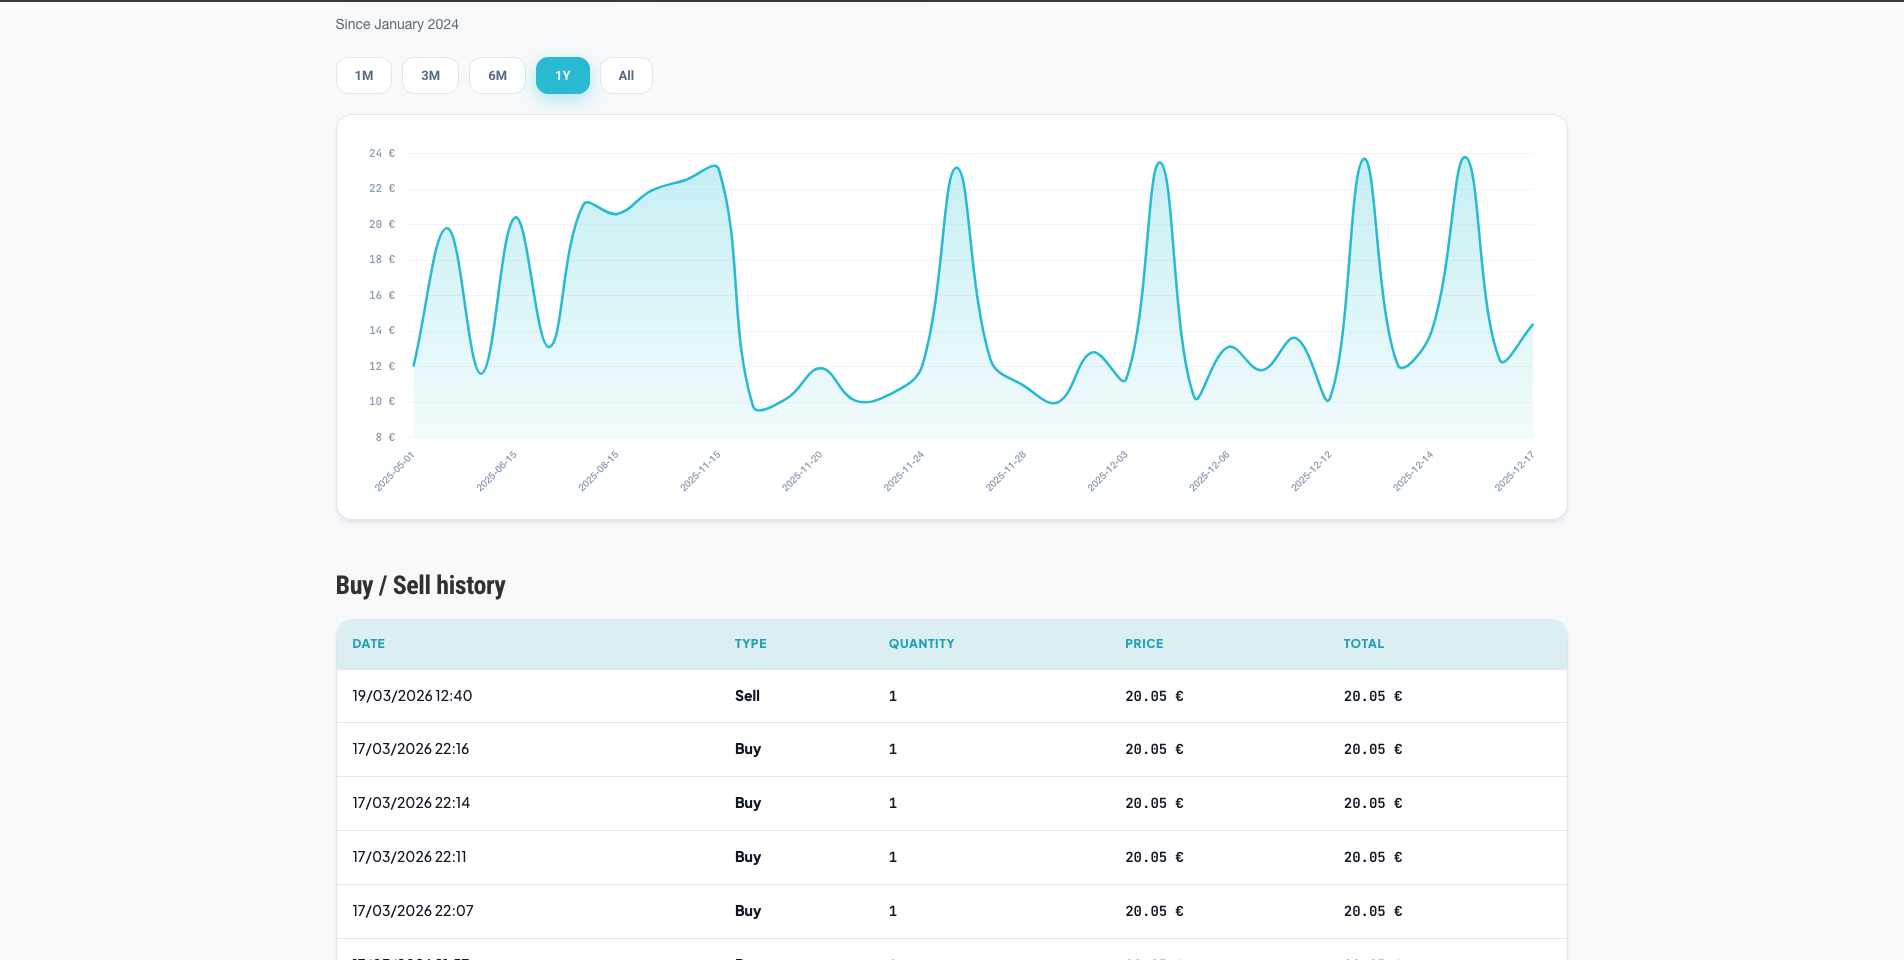
Trade History
Records every buy and sell with date, quantity and exact value. Essential for reviewing your successes and learning from mistakes.
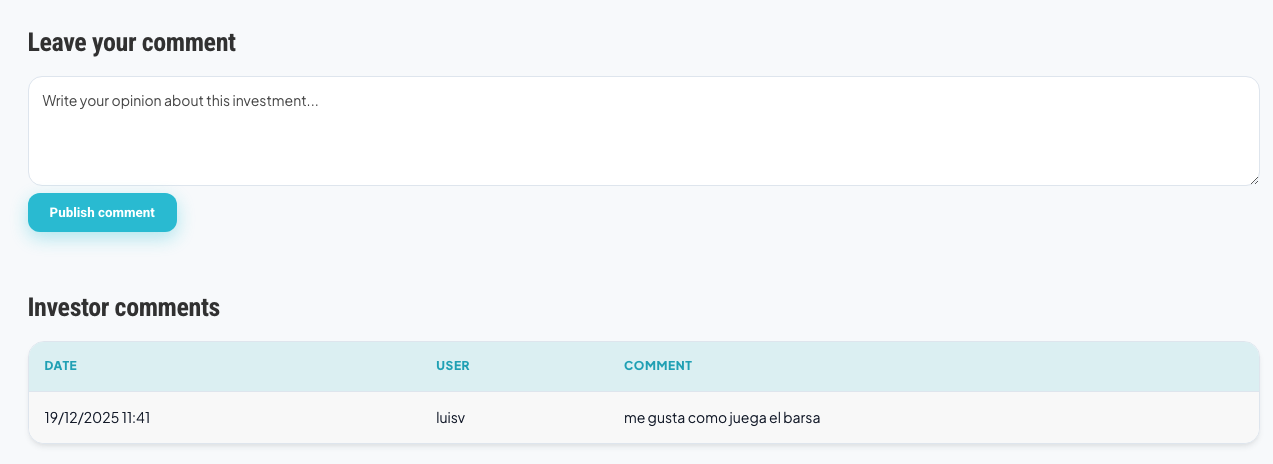
Social Section
Share your opinion or check what other traders think about the team's future. Collective intelligence is key in trading.